Tuesday, March 22, 2016

Contamination Control and Environmental Monitoring of GMP QC Cell-Based Bioassay Laboratories

Biotherapeutic medicines generated by living cells or organisms are larger and more complex than chemically synthesized, small molecule medicines and feature varied mechanisms of action (MOA). They also are more prone to heterogeneity, and subtle differences may occur across product lots, resulting from differences in conditions used in their production processes, including variables such as differences in cellular post-translational modification, cell passage and culture, production and purification.
Good manufacturing practices (GMP) quality control (QC) in vitro potency assays are required for the release of biotherapeutics, applied to demonstrate product performance consistency across lots and time. Bioassays often apply primary or clonal cells cultured under conditions that support modeling of the drug product’s cellular MOA, and often employ complex methods with multiple factors (product, cells, etc.) that influence variability and require highly trained scientists and analysts. To address this, guidance documents support the generation and validation of robust methods based upon a principle of relative potency (USP <111>, Chapters 1032, 1033 and 1034). Assay and test sample acceptance criterion are strictly set to identify good and bad assays and products, relative to method validation limits and characterized biotherapeutic reference standards.
Cells used are cultured via standard techniques, and bioassays are frequently performed without antibiotics because of the potential to affect product-specific responses. Microbial contamination also would alter the cell responses elicited, so successful validation and performance of these bioassays require they be performed by highly trained personnel in laboratories designed, equipped and controlled to prevent culture contamination. Integral to this process is having an effective contamination control (CC) program with analysts trained in the application of aseptic technique (Fresney, Basic Principles of Cell Culture; Culture of Cells for Tissue Engineering, Ch. 1 eds., John Wiley & Sons, Hoboken, NJ, 2006; and Phelan, Basic Techniques in Mammalian Cell Tissue Culture,Curr. Protoc. Cell Biol. 1.1.1 - 1.1.18, September 2007).
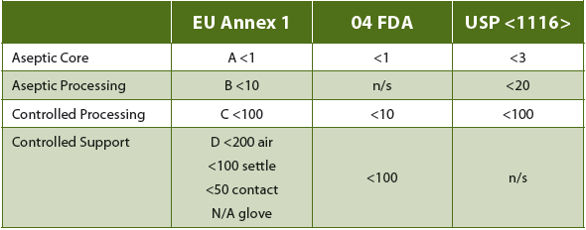
GMP QC cell-based bioassay laboratories (QC bio assay labs) do not perform aseptic manufacturing, but, for the reasons described above and because there are no regulations specific to their function, ISO 14644 (class 8), U.S. Food and Drug Administration (FDA) Sterile Drug Products Guidance (2004) and USP <1116>(controlled support), and Eudralex Volume 4 Annex 1 (grade D) manufacturing cleanroom recommendations/requirements are applied. The directives include appropriate design, engineering and process control infrastructure, validated CC and environmental monitoring (EM) programs to ensure both viable (Table 1) and non-viable particulate contamination limits are met, but are intended for facilities that support aseptic manufacturing processes. They greatly exceed the principles generally applied to cell and tissue culture.
Table 1. Regulation or Recommendations for Microbiological "In Operation" cfu Limits
Eudralex Vol. 4 An. 1 (15) directs that grade C and D monitoring “in operation should be based upon the principles of quality risk management.” The “requirements and action/alert limits will depend on the nature of the operations carried out.” While still directed at aseptic manufacturing and support operations, the only defined requirement (18) is that “monitoring should be frequent.” While some flexibility is generally expected and allowed in the recommendations/requirements for measures applied to such classified facilities, only current USP <1116> (38-NF33, 2015) cleanroom guidance suggests that non-sterile applications (such as QC bioassay labs) require different microbial control strategies. In addition, the current USP <1116> has recommended that, rather than defined microbial limits, sampling should be directed toward determination of contamination rates (Table 2) as a better estimation of CC program effectiveness. This is based upon acknowledgement that even ideal cleanroom design and operations cannot prevent all contamination, the source of which is invariably human operators. Expectations for establishing and maintaining a “sterile” environment are recognized in that document to be "technically not possible and unrealistic.” As these, too, are directed toward aseptic manufacturing and processing facilities, this can and does leave application of CC and EM method requirements subject to the interpretation of individual laboratories and regulatory agencies.
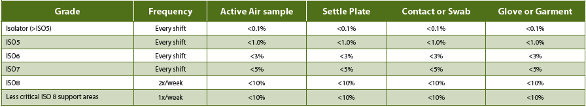
Table 2. USP <1116> Recommended Contamination EM Frequency and Incidence Rate Limits
Zoom In
PPD® Laboratories performs GMP QC bioassay testing in three GMPcompliant laboratories in the U.S. and Ireland. All are designed, built, controlled and monitored to comply with the aseptic manufacturing cleanroom controlled support requirements, and extending aseptic cell culture practices beyond those generally recommended (Table 3). PPD’s first QC bioassay lab (B5-156) was commissioned for GMP testing in 2008 at the site in Middleton, Wisconsin, U.S. It consists of a single, 750 ft2 controlled access lab with an exterior gowning/degowning room and operational workflow designed to support the validated CC program. Every biosafety cabinet (BSC) testing event currently includes non-viable particulate and viable settle plate EM. This is supplemented by limited weekly cleaning and EM sampling in BSCs and general lab areas; along with complete monthly cleaning, with full post-cleaning EM in BSCs and pre-and post EM for general lab areas. EM for mycoplasma contamination is performed quarterly. Results from EM are reported semi-annually, and, since implementation, no contamination trends nor any mycoplasma have been detected. There have been only four documented culture contamination events (none impacting QC testing, and none affecting cell bank generation) since recordkeeping was initiated in March 2012, while none have occurred since April 2013.
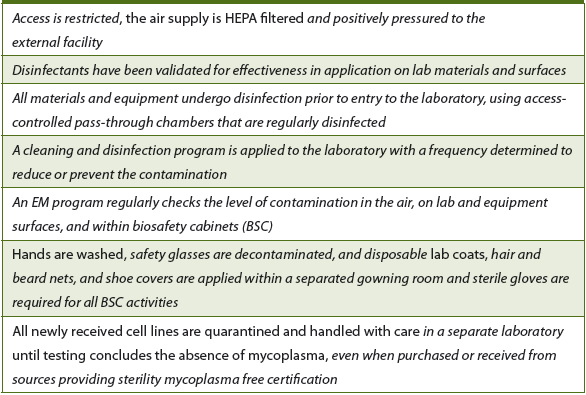
Table 3. PPD applied CC practices, compared with those described for basic aseptic cell culture principles (italics denote measures not described in basic principles)
In May 2013, PPD commissioned a second 6,200 ft2 controlled access lab suite (B8) in Middleton (GMP certification provided July 2015). A third lab, at PPD’s Athlone, Ireland, GMP facility (Athlone lab) was commissioned in October 2014, and added another 2,000 ft2 of bioassay testing labs to support EU GMP biotherapeutic testing (GMP certification provided January 2015). The design and materials of both suites were based upon B5-156, with controlled workflow and identical CC programs. However, because of the demonstrated effectiveness of the B5-156 program, EM was reduced to complete quarterly pre- and post-cleaning EM in the culture laboratory, and annual pre-and postcleaning EM in the rest of the suite (settle plates were added to the quarterly Athlone bioassay lab EM).
For the B8 site, EM reports are prepared annually, and no significant EM trends or mycoplasma have been detected since initiation of operations. In that laboratory suite, 16 culture contamination events were recorded since commissioning, and increased in frequency from July to September 2014. These did not correlate with an EM viable trending increase, and none impacted the generation of cell banks. In one case, culture contamination resulted in a three-day delay in testing a QC stability sample. As for the B5-156 laboratory, all culture contaminants were identified for genus and species, and all were associated with aquatic environments (all various species of Brevundimonas, Burkholderia, Methylobacterium and Ralstonia).
An investigation into the observed increase in culture contamination events for causes determined the following: 1) the water baths used to warm media and reagents were the likely contamination source; 2) during this period the required cleaning and EM were not being performed per SOPs; 3) increased staffing had doubled lab activities; and 4) cell culture/aseptic technique training of new employees varied by trainer. (Note: Half of the events were associated with training.)
Corrective action responses included: 1) changing the water bath microbicide; 2) retraining of cleaning/EM personnel and boosting EM oversight to ensure compliance; and 3) standardizing cell culture/ aseptic technique training. Since implementation in October 2014, there have been no instances of culture contamination in the laboratory (last event recorded was September 23, 2014).
To demonstrate that the Athlone lab’s application of the U.S. PPD CC and EM programs provided “adequate assurance of control in the environment” compared to other PPD labs performing the same function, a temporary (six month) increase in the EM program (above that applied in the B5-156 lab, with each analyst also performing weekly in-use viable air, surface, equipment and glove EM) was implemented. Prior to the conclusion of that study, the PPD Middleton B8 QC culture laboratory increased gowning (to apply disposable, whole body lab suits and boot covers); performed validation of disinfectant effectiveness and added sporocide to BSC material decontamination; and increased EM to a monthly culture lab frequency (quarterly for support areas) and weekly in-use viable monitoring (as applied temporarily in the Athlone lab). These activities have required a substantial increase in support staffing and have increased analyst time required to perform cell culture by approximately 20%.
Results generated from the Athlone lab six-month increased EM evaluation period (using the original CC program copied from the U.S. sites) and from the first three months of increased B8 culture lab BSC EM confirmed a lack of laboratory and in-use BSC sterility. At both sites, and across 32 analysts and almost 500 cell culture EM events, there was viable contamination observed (Tables 4 and 5), but no mycoplasma was detected. Viable contaminant levels were observed, but no coincidental excursions from PPD’s action/alert limits occurred and only three analyst glove contaminations occurred consecutively across EM events. Over this period, no EM trends were observed, and, in all but four instances (<1 5="" 90="" 93="" all="" and="" aseptic="" athlone="" b8="" b="" bscs="" but="" cfu="" class="" cleanliness="" cleanroom="" colony="" contamination="" controlled="" d="" em-detected="" em="" established="" eu="" events="" facilities.="" fda="" floors="" for="" forming="" grade="" in="" levels="" limits="" m3="" manufacturing="" met="" microbiological="" of="" operation="" outside="" p="" particulate="" processing="" respectively="" source="" support="" targets.="" the="" units="" were="" within="">
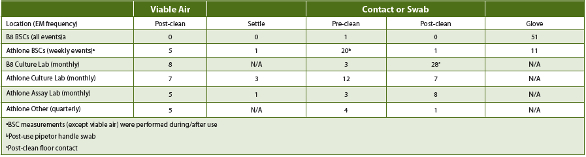
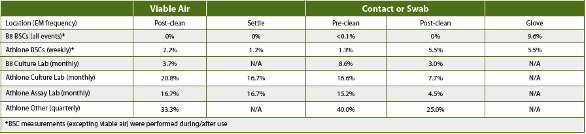
Table 4. PPD B8 Oct-Dec 2015 (Culture Lab only) and Athlone Jan-Jun 2015 Laboratory Contamination Load (high cfu/site)
Zoom In
Table 5. PPD B8 Oct-Dec 2015 (Culture Lab only) and Athlone Jan-Jun 2015 and Laboratory Percent Contamination Frequency
Zoom In
Assessing the increased facility CC and/or EM results based upon USP <1116> contamination frequency guidelines demonstrated that the QC labs’ BSCs met controlled support manufacturing cleanroom contamination frequency limits across the respective periods (Table 5), while the lab areas in Athlone did not. The EM results in Athlone and B8 demonstrated that cleaning procedures reduced, but did not eliminate, contamination events.
During the first three months after the increased BSC CC and EM were implemented, B8 EM observations did show reduced BSC contamination incidence and frequency compared to the Athlone EM during the sixmonth period that the original CC program was applied. However, the B8 settle plate results were similar to historical data collected in the B5-156 cell lab. There also was no indication that the extra CC measures had any impact on glove contamination, when comparing the Athlone and B8 EM results. In addition, the B8 culture lab EM, applying an unchanged CC program outside the BSCs, had ~50% of the observed EM contamination frequency as the Athlone lab.
Despite these EM results and since measures were implemented in the U.S. cell labs after introduction of corrective active measures following the September 2014 internal investigation, zero cell culture contamination events have been recorded at any PPD GMP QC bioassay laboratory.

Conclusions

GMP QC bioassay labs do notperform aseptic manufacturing/processing. However, efficient generation of cell cultures and banks to support such testing does require that effective CC (that incudes analyst training in aseptic technique) and EM programs be implemented to establish and maintain a sufficiently clean environment to support these activities. Another valuable indicator of CC program effectiveness is recording culture contamination events, as these can help establish frequency and identify patterns that might be indicators of a lack of appropriate CC.
CC program effectiveness also can be monitored by a bioassay’s failure rate. The complex and variable nature of these methods requires establishing validated system suitability specifications so as to enable detection of good and bad assays, as well as product. Contamination of cells can and does alter activity and result in assay failure. Repeated assay failures - triggering GMP quality investigations - can support identification of CC system failures.
It is estimated that at least 6,500 GMP QC sample tests have been performed and at least 100 cell banks generated since the initiation of culture contamination records (March 2012). While it is possible that cell culture contamination has resulted in assay failures, none have ever been recorded as a demonstrated cause within PPD’s QC bioassay labs. During this period, PPD’s QC bioassay labs have recorded 20 culture contamination events, all with organism identification related to aquatic environments. As noted previously, half were linked to a failure to follow cleaning and EM procedures over a three-month period and half occurred during analyst training, while none have been recorded since corrections were implemented in October 2014.
Throughout the service history of the PPD QC bioassay labs, application of validated CC measures (that includes recording of culture contamination events and monitoring of assay performance) and EM programs has demonstrated program efficacy equivalence to aseptic manufacturing controlled support cleanroom expectations, with no significant EM trending across sites and time. While culture contamination events have been recorded, only one has had an impact on GMP QC bioassay sample testing (resulting in a stability sample testing window being missed by three days) over a multi-year period.
The results of added EM testing at two sites over a three- and sixmonth period fail to link BSC in-use contamination with culture contamination events, supporting B8 observations in which routine EM did not trend with increased culture contamination events. Further, increased CC measures for that site did not decrease observed glove contamination event frequency, relative to the original CC program, when comparing the EM between the two sites. The increased CC had no impact on culture contamination, but, regardless of the CC program applied, no culture contamination was observed in either laboratory.
It is possible to conclude that, with PPD’s original CC program and its highly trained staff, a reduced EM plan (that includes reporting and assessment of culture contamination and linked assay failure events) is adequate to ensure proper cleaning/disinfection is reducing contamination to a level that allows for effective GMP QC bioassay testing.
In summary, it is appropriate that, in the absence of specific regulations, QC bioassay labs follow available aseptic manufacturingcontrolled support regulations and appropriate application of quality risk management supported by facility performance histories, as directed by Eudralex Vol. 4 An. 1 (15). However, as our results clearly demonstrate, GMP QC bioassay lab CC and EM programs can be effective without meeting the requirements of aseptic manufacturing core or processing cleanrooms, as their expectations for generation and maintenance of a nearly aseptic environment are required toprevent product contamination, while GMP QC bioassay labs need only to keep cell cultures free of microbial contaminants. PPD’s data suggest that an effective CC program that combines EM, monitoring of culture contamination frequency and organism identification, and GMP required fit-for-purpose application and monitoring of rigid and specific test method system suitability are adequate measures for such laboratories. We encourage the initiation of dialogue between industry and regulatory agencies to determine and recommend best practices, so as to reduce the current variability of CC and EM applied and expected programs.

Regulatory Strategy for Long-Term Stability Conditions to Support Submission in Zone IV Countries

Regulatory Strategy for Long-Term Stability Conditions to Support Submission in Zone IV Countries

This paper provides a recommendation for selection of long-term stability conditions for submission of room temperature storage drug products in Zone IV countries in the face of a confusing mixture of expectations from international regulatory bodies. This confusion has resulted from multiple messages from groups such as the International Conference on Harmonization (ICH), the World Health Organization (WHO), regional associations of nations, and several individual countries themselves. The scope of this paper covers drug products currently in development as well as approved drug products which may be required to provide Zone IV stability data as a condition for registration renewal or to support post-approval changes.
Drug substances (active pharmaceutical ingredients) are not explicitly covered in this paper. However, it is worth noting that stability study conditions for API are based on the mean kinetic temperature and anticipated humidity exposure of the actual storage conditions for the API. Drug substances manufactured or used by many firms typically are not exposed to Zone IV storage temperatures for any significant period of time. Short-term exposure to local ambient conditions during the transportation period to drug product manufacturing sites can be supported by accelerated stability data packages (40ºC/75%RH).
It has long been recognized that the difference in climatic conditions in varying regions of the world need to be taken into consideration when planning stability studies to determine the shelf-lives of drugs. Grimm examined world climatic data and demonstrated the importance of taking this into account by proposing different stability conditions for different climatic zones [1,2]. Zone I was defined to Temperate, Zone II Subtropical or Mediterranean, Zone III hot and dry, and Zone IV hot and humid. This work provided a basis for the ICH to propose a unified approach among the United States, the European Union, and Japan, all in climatic Zone II, for stability studies to be performed at 25ºC/60% RH for long-term testing in 1993 [3].
Further work by the ICH Stability Working Group led to the idea of a single long-term stability condition for Zone IV countries which would also serve as an intermediate condition/alternative long-term condition for Zone II countries. Their proposal to use 30°C/65% RH as this condition was embodied in ICH Q1F, which was adopted by the ICH Steering Committee in February 2002 [4]. However, the proposal did not receive sufficient support from Zone IV countries, many of which noted that they experienced higher relative humidity than the recommended 65%.
In 2005 the ASEAN group of nations (Indonesia, Malaysia, the Philippines, Singapore, Thailand, Brunei, Burma (Myanmar), Cambodia, Laos, and Vietnam) published a draft regional stability guidance that called for long-term stability studies to be performed at 30ºC/75% RH [5]. Soon after, Brazil, which had changed its long-term stability requirement from 30ºC/70% RH to 30ºC/65% RH after the publication of ICH Q1F, changed again, this time to 30ºC/75% RH [6]. As a result, ICH withdrew the Q1F guidance in 2006 [4].
In October of 2005, the WHO took the position of creating a Zone IVa and IVb which would have long-term stability data requirements of 30ºC/65% RH and 30ºC/75% RH, respectively, and allowing each country to designate which sub-zone it was in [7]. The current WHO stability guidance has an appendix listing countries and the sub-zone they have selected [8].
In addition to requiring Zone IV stability data for registration of new drugs, a number of countries, such as Brazil, also require that firms provide Zone IV stability data for registration renewals or to support post-approval changes, even where such data was not in the original submission [6].

RECOMMENDED APPROACH FOR PROVIDING STABILITY DATA FOR ZONE IV COUNTRIES

Since some Zone IV countries require 30ºC/75%RH stability studies while others will accept 30ºC/65%RH data, firms wishing to register their drugs globally are faced with a dilemma. It is not economically practical to perform two sets of Zone IV stability studies, one at 30ºC/65%RH and another at 30ºC/75%RH.
Therefore, we recommend that room temperature drug products to be registered in Zone IV countries be supported by:
  1. 30ºC/75%RH long-term stability data on at least one package configuration for dry solid oral products.
  2. 30ºC long-term stability data on at least one package configuration for parenteral products.
  3. Other package configurations for solid oral products and parenterals may be tested under Zone IV conditions as above or dealt with by bracketing.
One clarification regarding point (b) above is useful to note. The exclusion of humidity in the recommended conditions for stability studies of parenterals is specific to drug products packaged in impermeable containers. The exclusion is not based on the product itself but on whether it is packaged in an impermeable container and intended for room temperature storage. The classification of packaging as moisture impermeable should be evaluated based on Moisture Vapor Transmission Rate (MVTR) data. It should be noted that glass vials with a rubber stopper are not automatically defined as impermeable by any regulatory authority. Where 30°C/75%RH data do not exist, but either 30ºC/65%RH data or 30ºC/ambient humidity data are available, it may be possible TESTINGto demonstrate that a particular vial/stopper/crimp combination is impermeable by providing actual MVTR data to the regulators.
Development teams must look carefully at early stability data and at marketing plans and decide on packaging that will provide adequate protection at 30ºC/75%RH. Packaging more protective than that used for Zone II countries may be needed. Teams will also have to determine when to begin the primary stability studies at Zone IV conditions. This timing will be a business decision based on submission plans in the Zone IV countries which require this data, therefore communication between marketing and development and Regulatory Affairs is essential.
For products marketed in Zone IV countries which require 30ºC/75% RH or 30ºC/65%RH stability data for registration renewal or to support post-approval changes, the development team should assess the available stability data. Data may have been generated at 30ºC/65%RH (per the withdrawn ICH Q1F recommendations). Many Zone IV countries will accept this data, in some cases even where 30ºC/75% RH is expected for new products. If neither 30ºC/75% RH or 30ºC/65%RH data is available, new stability studies may need to be initiated. This may mean that the product packaging has to be reevaluated, as some products that are stable at 25ºC or 30ºC at low humidity, may not be so at 30ºC/75% RH.
Table 1 - Countries Recommended for Zone II Long-Term Stability Conditions
A: From regional harmonization groups (e.g., ASEAN, ICH and GCC) or country regulators to WHO
B: From country regulators to WHO at 13th International Conference of Drug Regulatory Authorities (ICDRA),16–18 September 2008
C: Information provided by the International Federation of Pharmaceutical Manufacturers and Associations (IFPMA) based on literature references
Zoom In
The remainder of this paper includes three tables derived from the 2009 WHO stability guidance [8] covering approximately 200 countries and listing both the long-term stability conditions provided for in the WHO document and our recommended long-term stability conditions. Table 1 lists those countries for which 25ºC/60%RH is recommended in the WHO guide. Our recommendation for the countries listed in Table 1 is to use either 25ºC/60%RH or 30ºC/75%RH. If a drug product is sufficiently stable, then 30ºC/75%RH represents a single long-term stability condition TESTINGfor all global submissions. If the drug product is not sufficiently stable, then 25ºC/60%RH would be used for registration in the US, EU, and other Table 1 countries. For registration in other countries, more protective packaging or other measures to ensure stability at 30ºC/75%RH would be necessary.
Table 2 - Countries Known to Expect Zone IV Long-Term Stability Conditions
A: From regional harmonization groups (e.g., ASEAN, ICH and GCC) or country regulators to WHO
B: From country regulators to WHO at 13th International Conference of Drug Regulatory Authorities (ICDRA),16–18 September 2008
Zoom In
Table 3 - Countries Estimated to Have Zone IV Climatic Conditions That Did Not Provide Specific Requirements to WHO
C: Information provided by the International Federation of Pharmaceutical Manufacturers and Associations (IFPMA) based on literature references
Zoom In
Table 2 lists those countries for which 30ºC/75%RH is recommended in the WHO document based on information taken from a regional guidance such as the ASEAN stability guidance [5] or from direct communication from a specific country’s health authorities to WHO [8]. Table 3 lists countries for which 30ºC/75%RH is recommended based on climatic information obtained by WHO from the International Federation of Pharmaceutical Manufacturers and Associations (IFPMA). For countries listed in Table 3, because WHO could not obtain a clear indication of their long-term stability requirement, it is essential to verify current expectations on a country-by-country basis for every planned regulatory document which requires stability data whether for registration, re-registration, or post-approval changes. If the current stability requirements for a country cannot be verified, then 30ºC/75% RH data requirements for countries in Table 3 must be assumed as accurate and such data provided in regulatory submissions.
In summary, this paper represents a snapshot in time with our current best understanding of expectations in approximately 200 countries; verification of a country’s regulatory expectations in respect to Zone IV stability should be considered as country expectations continue to evolve and change.

SOME COUNTRY-SPECIFIC NOTES

  1. The entry for Canada in the WHO guidance lists the long-term stability condition as 30ºC/65%RH only [8]. This is at odds with Canada’s adoption of its own version of the ICH Q1A guidance which clearly states, “It is up to the applicant to decide whether long-term stability studies are performed at 25 ± 2°C/60% RH ± 5% RH or 30°C ± 2°C/65% RH ± 5% RH [9]." Therefore we have placed Canada in Table 1.
  2. The entry for Iraq in the WHO guidance provides for a long-term stability condition of 30°C/35% RH [8]. This is presumably because Iraq is actually a climatic Zone III country, that is, hot and dry. Long-term stability testing at low humidity is particularly important for drugs in aqueous solution in semi-permeable containers to ensure that moisture loss from the drug product over time does not lead to excessive concentration, erroneous dosing or drug substance precipitation. Such testing is provided for in ICH Q1A [3]. If it cannot be established that the container is of sufficiently low permeability, then long-term testing at 30°C/35% RH should be considered.
  3. The entry for Israel in the WHO guidance provides for a long-term stability condition of 30°C/70% or 30°C/75% RH, but it is our understanding that Israeli regulators consider it to be a Zone II country and are working with WHO to change its entry in the guidance. As noted above, regulatory expectations must be verified.
  4. Questions frequently arise regarding the classification of Australia. As stated in the Australian Regulatory Guidelines for Prescription Medicines, Appendix 14, Australia has climatic conditions encompassing ICH Zones II-IV, and accepts data generated at stability conditions as laid out in ICH Guidelines [10]. Australia, therefore, does not require Zone IV stability data.
  5. Questions also frequently arise regarding Puerto Rico. As a territory of the US with commonwealth status, Puerto Rico is subject to U.S. Federal Laws, e.g., 21CFR 276 (b)(13). “United States means the Customs territory of the United States (i.e., the 50 states, the District of Columbia, and the Commonwealth of Puerto Rico), but not the Territories." The U.S. FDA expectation of Zone II stability conditions therefore includes Puerto Rico.

CONCLUSION

There has been a great deal of confusion about the proper choice of long-term stability conditions for various countries. This has resulted from conflicting advice from sources such as ICH and WHO that would otherwise have been expected to provide clear, scientifically based recommendations in this area. The decision of WHO to accept a mixture of 30°C ± 2°C/65% RH ± 5% RH and 30°C ± 2°C/75% RH ± 5% RH on a country-by-country basis for climatic Zone IV lead to our recommendation to select 30°C ± 2°C/75% RH ± 5% RH as a single condition to be used for all Zone IV countries since running parallel stability studies at both conditions would be prohibitively expensive. There have also been questions of how, exactly, it can be determined whether a country is a Zone IV country or not. Since the WHO has decided to let each country determine its own status without providing a clear cut set of temperature/humidity criteria to differentiate one climatic zone from another, a list of countries with assignments is needed. This paper provides such a list in Tables 1-3, basing it on the 2009 WHO stability guidance. It is important to remember, however, that the information in this paper represents the situation at the time of writing and with 200 countries to deal with, some change must be expected over time. Therefore, the recommendations provided in this paper should be verified prior to initiating stability studies.

REFERENCES

  1. Grimm, W. Drugs Made in Germany, 28, 196-202 1985.
  2. Grimm, W. Drugs Made in Germany, 29, 39-47 1986.
  3. ICH Q1A (R2), Stability Testing of New Drug Substances and Products (current version 2003). http://www.ich.org/LOB/media/MEDIA419.pdf.
  4. ICH Q1F, Stability Data Package for Registration Applications in Climatic Zones III and IV, (published 2002, withdrawn 2006) http://www.ich.org/LOB/media/MEDIA3124.pdf.
  5. ASEAN Guideline On Stability Study Of Drug Product 2005.http://pharmalytik.com/images/stories/PDF/asean%20stability%20guidelines%20-%2022%20feb%202005.pdf.
  6. Resolution No. 1 of July 29, 2005, Guide For The Undertaking Of Stability Studies, Brazil 2005.
  7. Consultation of Stability studies in a global environment, WHO 2005. (http://www.who.int/medicines/areas/quality_safety/quality_assurance/ConsultStabstudies/en/).
  8. WHO Expert Committee on Specifications for Pharmaceutical Preparations, 43rd Report, Annex 2, Stability testing of active pharmaceutical ingredients and finished pharmaceutical products, WHO Technical Report Series, No. 953, 2009, pages 87-127.http://www.who.int/medicines/publications/pharmprep/pdf_trs953.pdf#page=101.
  9. Canada: Adoption of ICH Guidance: Stability Testing of New Drug Substances and Products - ICH Topic Q1A(R2), file number 03-118437-914 2003. http://www.hc-sc.gc.ca/dhp-mps/prodpharma/applic-demande/guide-ld/ich/qual/q1a(r2)-eng.php.
  10. Australian Regulatory Guidelines for Prescription Medicines, Appendix 14, Stability Testing, 2004. http://www.tga.gov.au/pmeds/argpmap14.pdf.

Process Validation Challenges for Technology Transfer

ABSTRACT

For a commercial technology transfer, the ultimate measure of success is regulatory approval of the transferred process at the new site. A major step in obtaining regulatory approval is the process validation package. Successful design and execution of process validation requires proactive planning for both technical as well as logistical challenges. This article will discuss some common challenges that are faced as well as strategies to overcome them.

INTRODUCTION

Technology transfers inherently involve a number of technical as well as logistical challenges.
Overcoming these challenges successfully within project timelines requires careful planning. One major activity in technology transfer and licensure of the process at the new facility is the process validation which demonstrates that the new facility delivers product of comparable quality with consistent performance. Considerations and strategies to successful validation of a transferred process are discussed here.

FACILITY FIT ASSESSMENT

One of the first challenges to overcome in transferring a manufacturing process is to fit the process into the target facility. In the initial stages of the technology transfer, a comprehensive review of process requirements and comparison with facility capabilities should be performed. A thorough fit assessment up front can help avoid unexpected delays or hidden costs later. Common examples of process requirements to evaluate include the expected titer/scale for the process against available column sizes and loading densities; comparison of expected flow rates and pressures against equipment ranges; evaluation of expected product pool sizes against tank storage capacities and effective mixing ranges; review of process temperature ranges against equipment temperature control capability; and review of chemicals used in the process for any impacts on waste limits or chemical storage permits. Local regulations on discharge limits can vary widely, and care should be taken to ensure that the assessment is performed against the applicable regulations for the target site.
Any changes to the process to accommodate the facility fit may result in additional process validation requirements. Changes should be minimized as practically feasible, utilizing the same scale and equipment as the original site when possible. When scaling up to a larger facility, maintaining the same scale factor across the entire process train should be targeted. Practically, there will always be some differences between facilities. A remediation plan for any potential gaps should be prepared, along with a risk assessment of any potential changes or differences. Gaps can be addressed either by facility modifications, which may entail capital investment, or by changes to the process itself, which may require process validation or characterization to support. While an upfront capital investment may seem undesirable, the time and resources required for the additional validation activities should also be considered. The decision should also factor in the criticality or impact of the step on product quality. Minimizing process changes minimizes risk of unintended differences in process performance and product quality, and may also facilitate regulatory approval for the transfer.

DOCUMENTATION

Once the process fit into the facility is defined, a site-specific process description and process flow diagram help to document and communicate the implementation plan across the various functional groups involved in the transfer (e.g., Engineering, Manufacturing, Process Development, Quality, Regulatory). Highlighting facility differences or process changes between the originating site and the receiving site in these documents will also facilitate assembly of a process validation project plan. The process validation project plan should include not only those additional studies required to support process changes, but also those studies which will be used to demonstrate the comparability of the product quality and the process performance. In constructing the validation project plan, one should also consider which unit operations may require site-specific studies at full-scale even with no changes to the process. For example, differences in piping or valve configurations may need to be accounted for by full-scale validation. A risk-based approach can be used to determine and document whether a site-specific validation study is required.
Leveraging existing process validation studies can help to streamline the validation plan, but the rationale for the applicability of those previous studies to the transfer at hand should be clearly documented. In projects where timelines are critical or constrained, making use of document templates can prove effective. Templates can help to provide consistency as well as limit the amount of review required in later phases of the project when technical resources are needed for other activities associated with the process transfer. The templates can undergo initial review with placeholders for missing details, followed by a final review with the data once available. However, this approach also requires careful document management and project management to ensure critical information receives the appropriate review once populated. For example, drafting of regulatory submissions may begin prior to completion of all process validation and characterization studies. Final review of the submission should ensure that all stated process parameter ranges match the ranges supported by the validation.

PROCESS SAMPLES

Process validation activities require many manufacturing process samples beyond those typically needed for QC in-process and release testing. To ensure that all the samples needed to support validation are acquired during the manufacturing campaign, a comprehensive sampling plan should be developed. The sampling plan should include a list of samples required to support process validation activities, as well as details on sample container types, storage temperature requirements, the analytical testing to be performed for each sample, and the testing timeline. If the samples will require shipment, one must also consider what additional materials are required for shipment – for example, shipping containers, temperature monitoring devices, and documentation for chain of custody. Seemingly simple decisions such as container type can often have a big impact. For samples which will be stored frozen, the physical properties of the container material should be evaluated to ensure that the container will not become fragile or brittle at the intended storage temperature. For samples which will be shipped on dry ice, the gas permeability of the container should also be evaluated. Higher gas permeability may result in changes to the sample pH due to diffusion of carbon dioxide.
In addition to the samples required to support process validation studies, additional samples may also be desired for potential troubleshooting activities. For example, a sample of manufacturing feedstock can be processed in a lab-scale model to help determine if unexpected issues seen at full-scale are feedstock-related or facility-related. Having a lab-scale model available in which studies can be run in real-time, or as close to manufacturing production as possible, can be useful in such cases.

RESOURCES AND RESPONSIBILITIES

It is also critical to identify and gain agreement on who will execute the outlined studies, as well as a timeline for the activities involved. In the 2011case of process validation studies, these activities include who will author the protocol, obtain the samples, deliver samples, perform analytical testing, and prepare the summary report. The roles and responsibilities should be clearly defined for all activities. Technology transfers are inherently multi-functional projects involving more than one site, and one site may assume an activity is the responsibility of the other. Defining all activities up front ensures an activity is not overlooked later. Similarly, expected lead times should be reviewed and documented, as lead times for an activity may be different from site-to-site. Availability of raw materials or consumables, shift coverage, and analytical testing lead times are all examples of activities which should be examined for differences between sites. Close coordination and communication between all the resources involved is critical, as timelines often can shift during the course of the project.

LOGISTICAL CONSIDERATIONS FOR INTERNATIONAL TRANSFERS

Additional challenges are faced when the technology transfer is to a facility in a different country than the originating site. There are the additional communication challenges of a different culture, different language, and/or different time zone. Even in instances where English is spoken proficiently by all team members as the common language, different cultural influences can result in different interpretations for a given word or phrase. While technological networking advancements have made it far easier to hold teleconference meetings while viewing a common presentation in real-time, occasional face-to-face meetings are still invaluable in establishing relationships and developing an innate understanding of each team member’s communication style.

CONCLUSIONS

Technology transfers are highly complex, multi-functional projects, but anticipation of the challenges can help ensure success. Careful evaluation of the process fit with the facility and minimizing changes; clear documentation of the process and project plan; defined roles, responsibilities, and timelines; and an appreciation for cultural differences between originating and receiving sites are all considerations that, when accounted for up front, can help to ensure a successful technology transfer and validation